Role: Senior UX Design Consultant
Client: Deloitte

Sales Representative Dashboard
Overview & Objective
Goal: Create a B2B centralized sales dashboard for sales representatives across all levels
Purpose:
→ Provide a clear, actionable view of opportunities across all deals in one universal dashboard
→ Guide users toward the most effective action(s) for closing won deals quickly
Key Outcomes:
→ Reduced time spent on repetitive tasks and manual information digging
→ Cut research time by 50% through a centralized dashboard, using AI and insight-driven design
→ Enabled faster, more informed decision-making, using key visuals — helping sales rep prioritize tasks
Business Context
Deloitte’s legacy system, Jupiter, lacked an intuitive UX and the ability to easily direct users to take proper next steps
A major pain point was that data wasn’t actionable — users couldn’t easily identify what required attention or how to prioritize tasks
Sales representatives requested a dashboard that highlights critical opportunities and recommends actions to optimize workflows
For example, when an account was nearing closure in the sales pipeline, the UI needed to guide reps on specific actions to help finalize “close won” deals.
Discovery & Research
Mapped workflows and conducted interviews with Deloitte sales reps to identify user needs
User interviews uncovered pain points, desired features, and ideas on how to enhance task efficiency
Collaborated with the client to gain alignment on deliverables, and define key success metrics
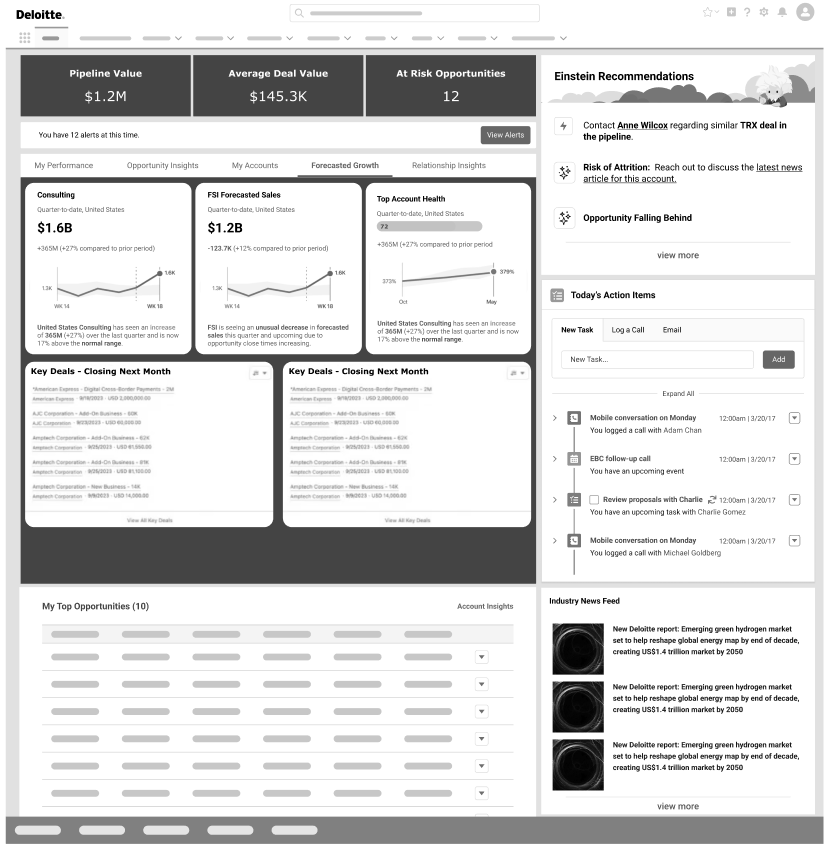
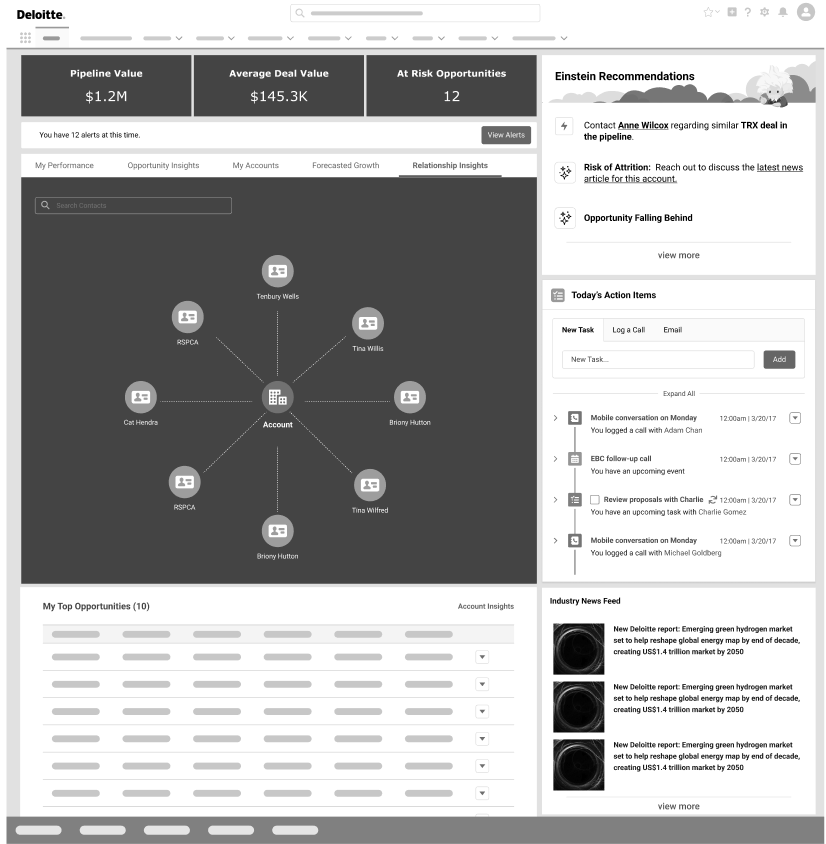
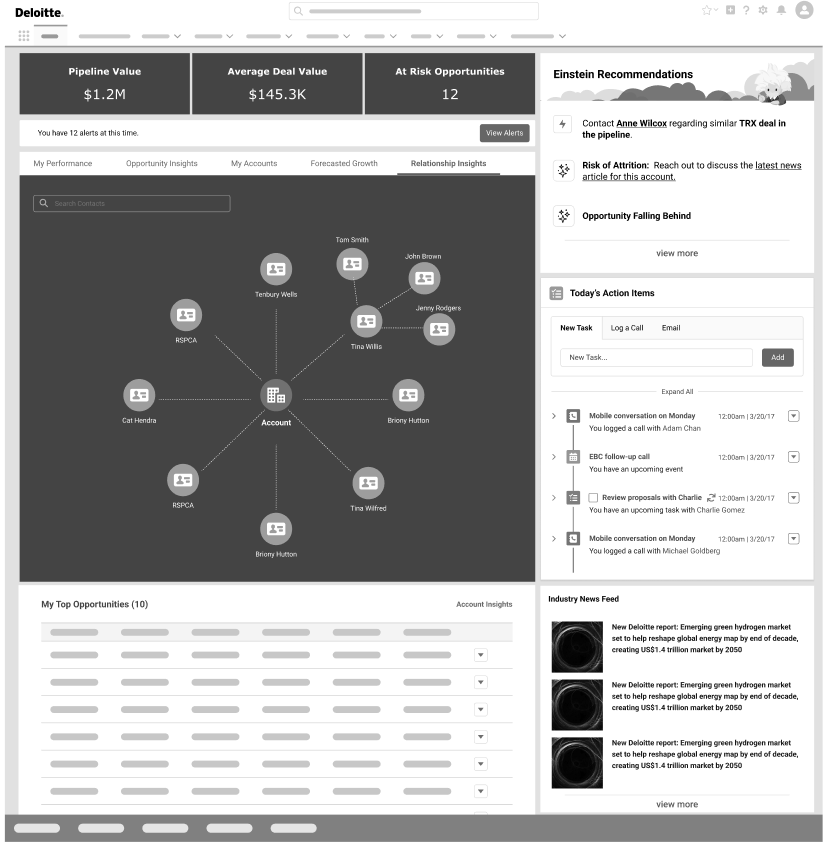
Designed a dashboard to surface opportunities, track performance, and reveal relationship insights
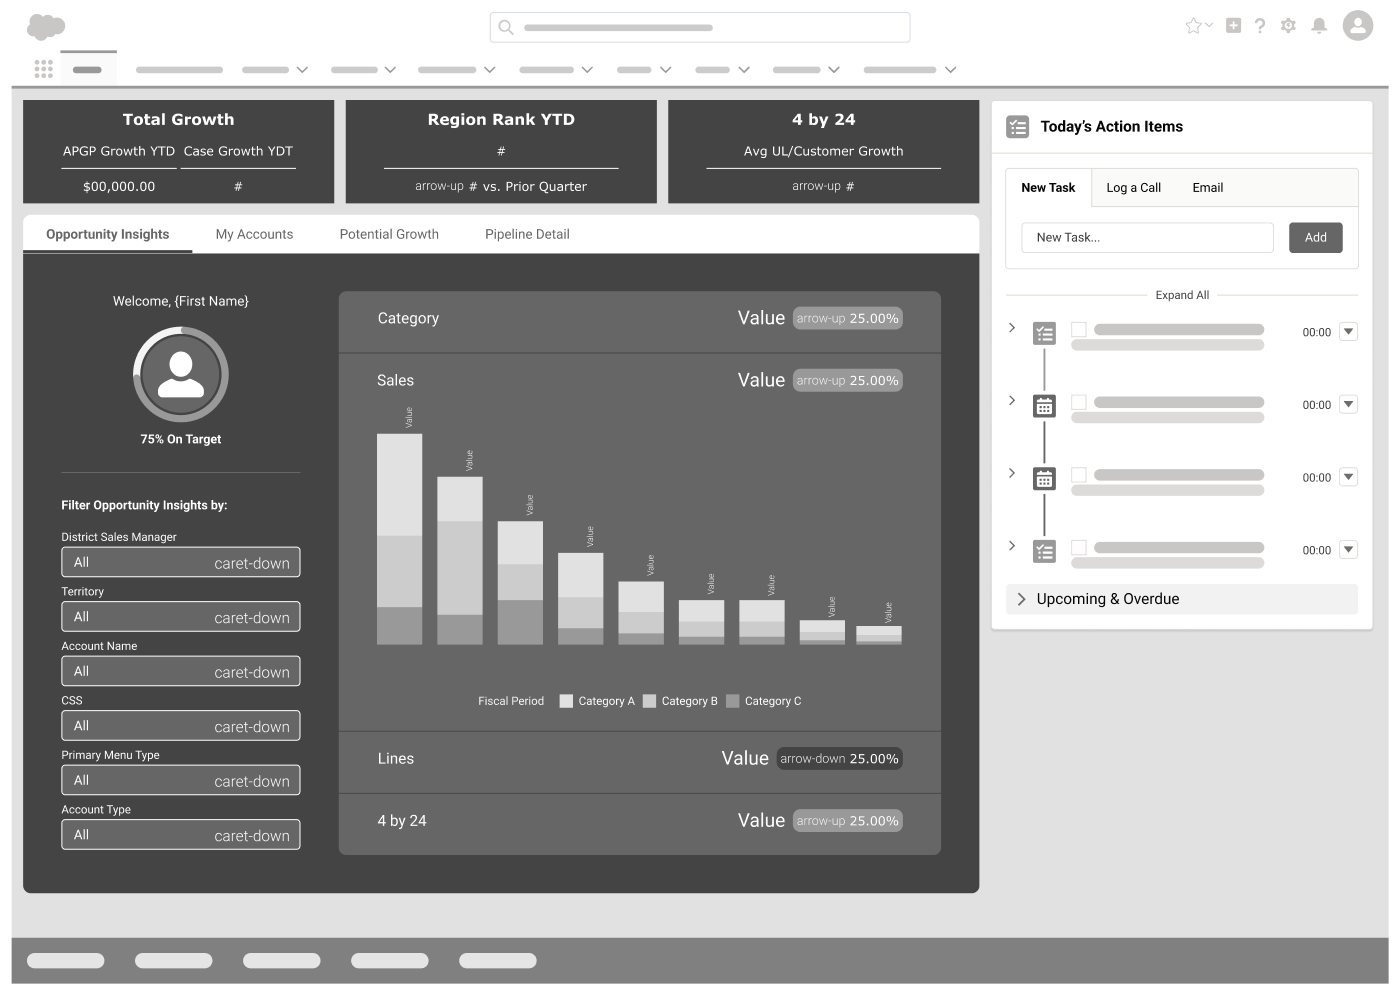
Developed low-fidelity wireframes for conceptual validation; eventually refined into high-fidelity prototypes based on stakeholder feedback
Low Fidelity wireframe explorations are shown below
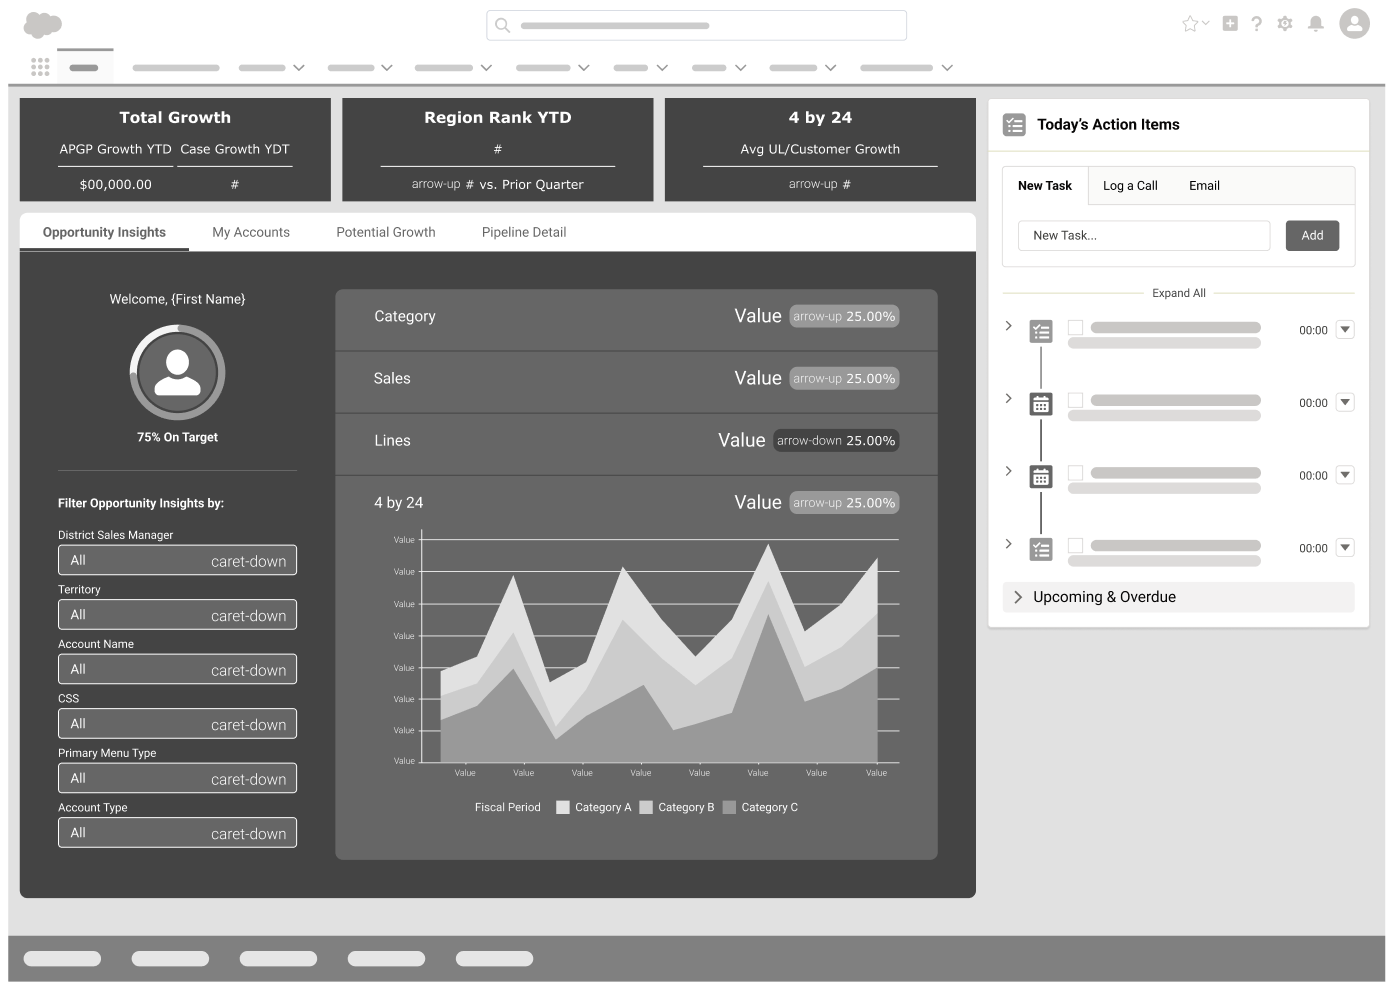
Design Iteration & Prototyping
Began with a request for a manager-level dashboard to track an unknown number of opportunities and accounts.
We decided to conduct user interviews which revealed what is most important to these sales reps and what would be most helpful
Concluded the dashboard needed to be universal — effective for both managers and individual sales reps with fewer opportunities
This will result in data changing dynamically depending on what user is logged in ex/ a director might log in and see thousands of accounts and opportunities vs. a less seasoned sales rep might see very few in their pipeline
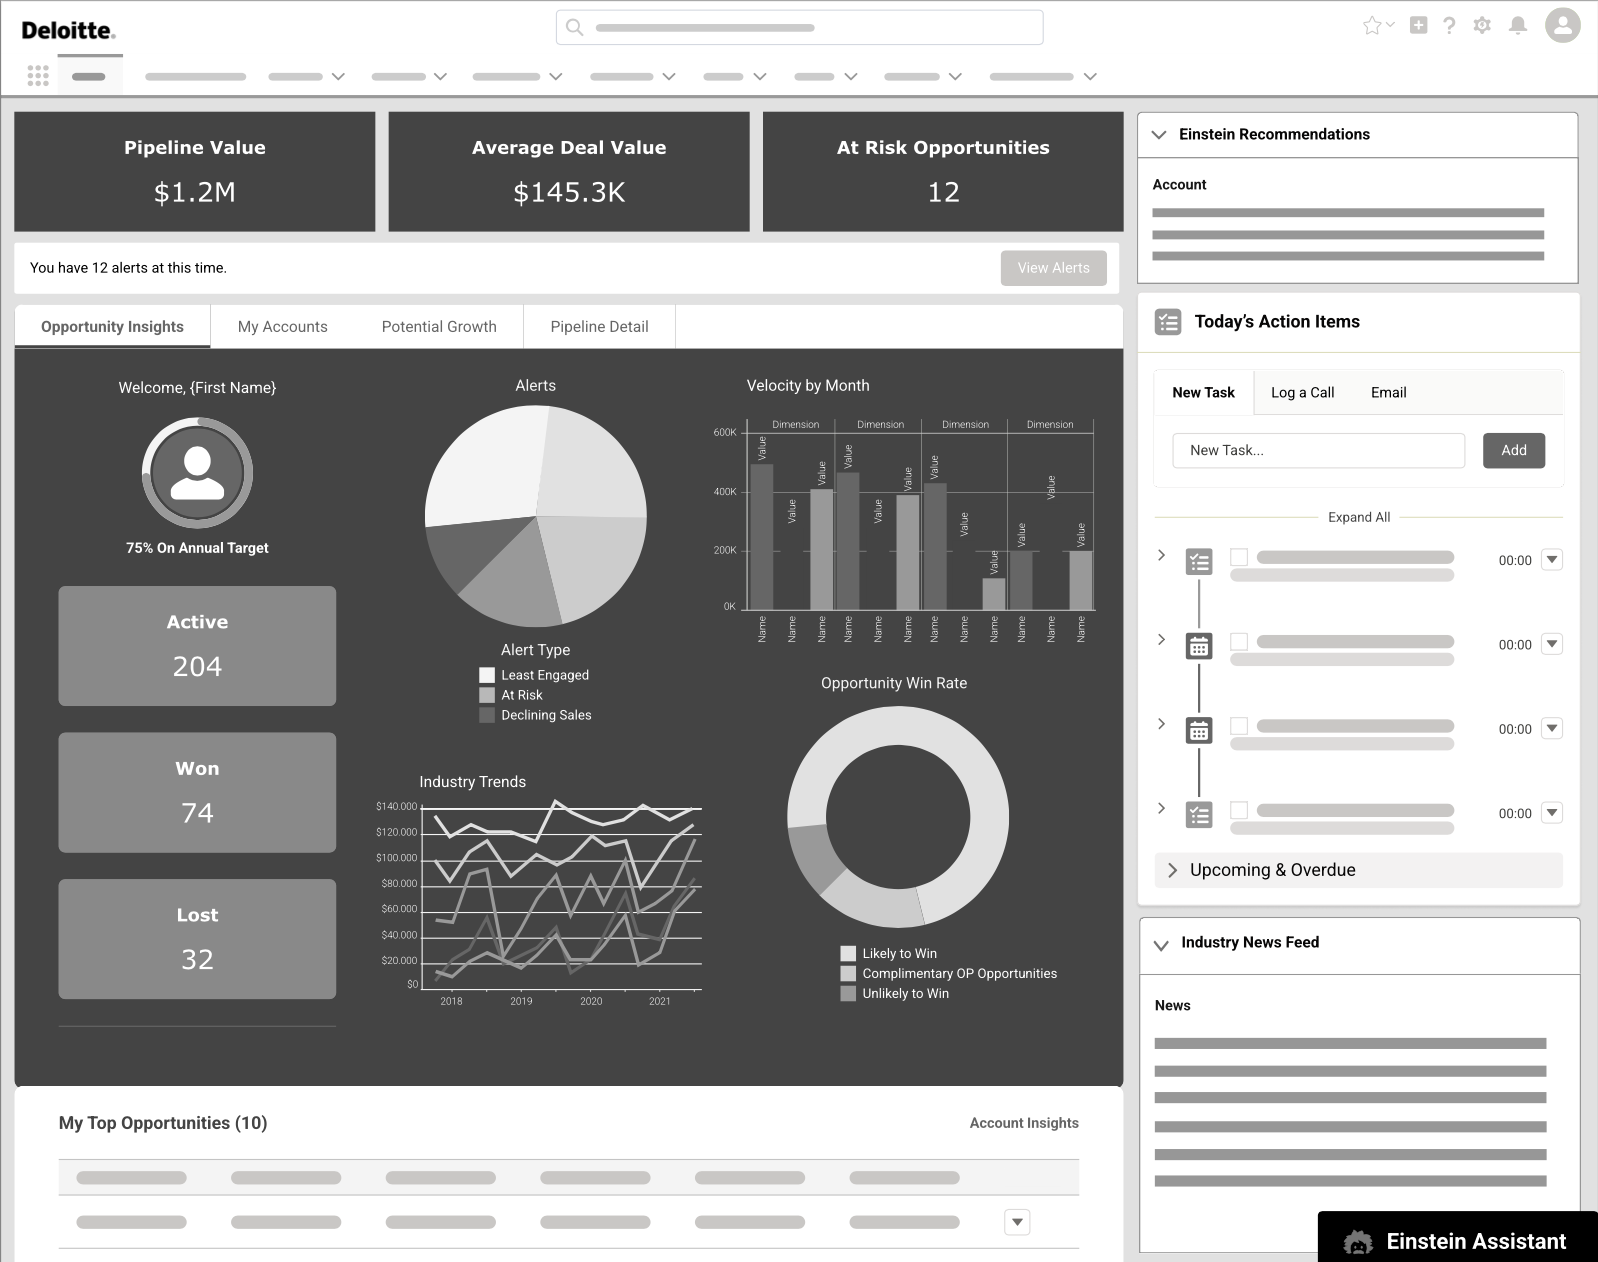
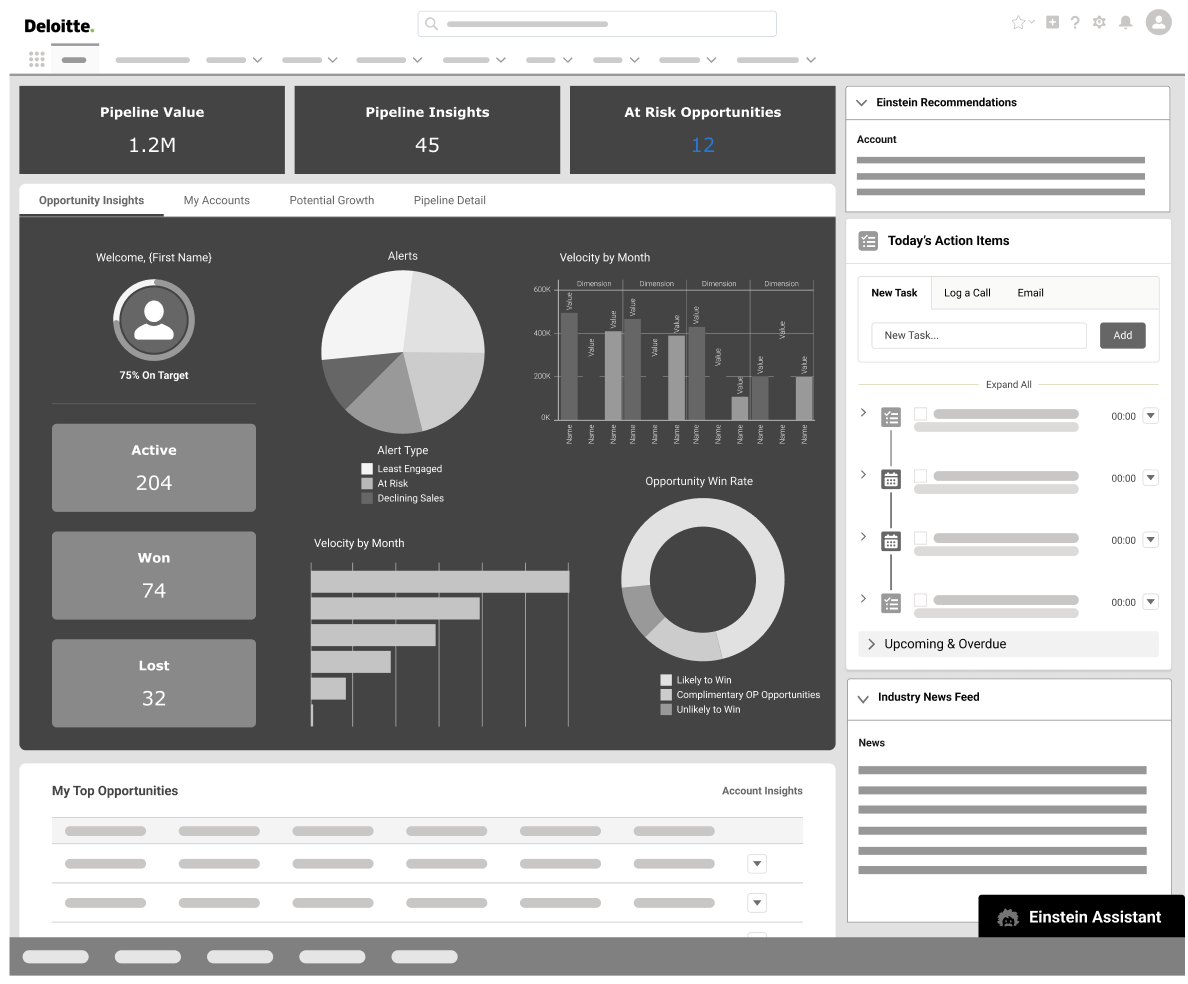
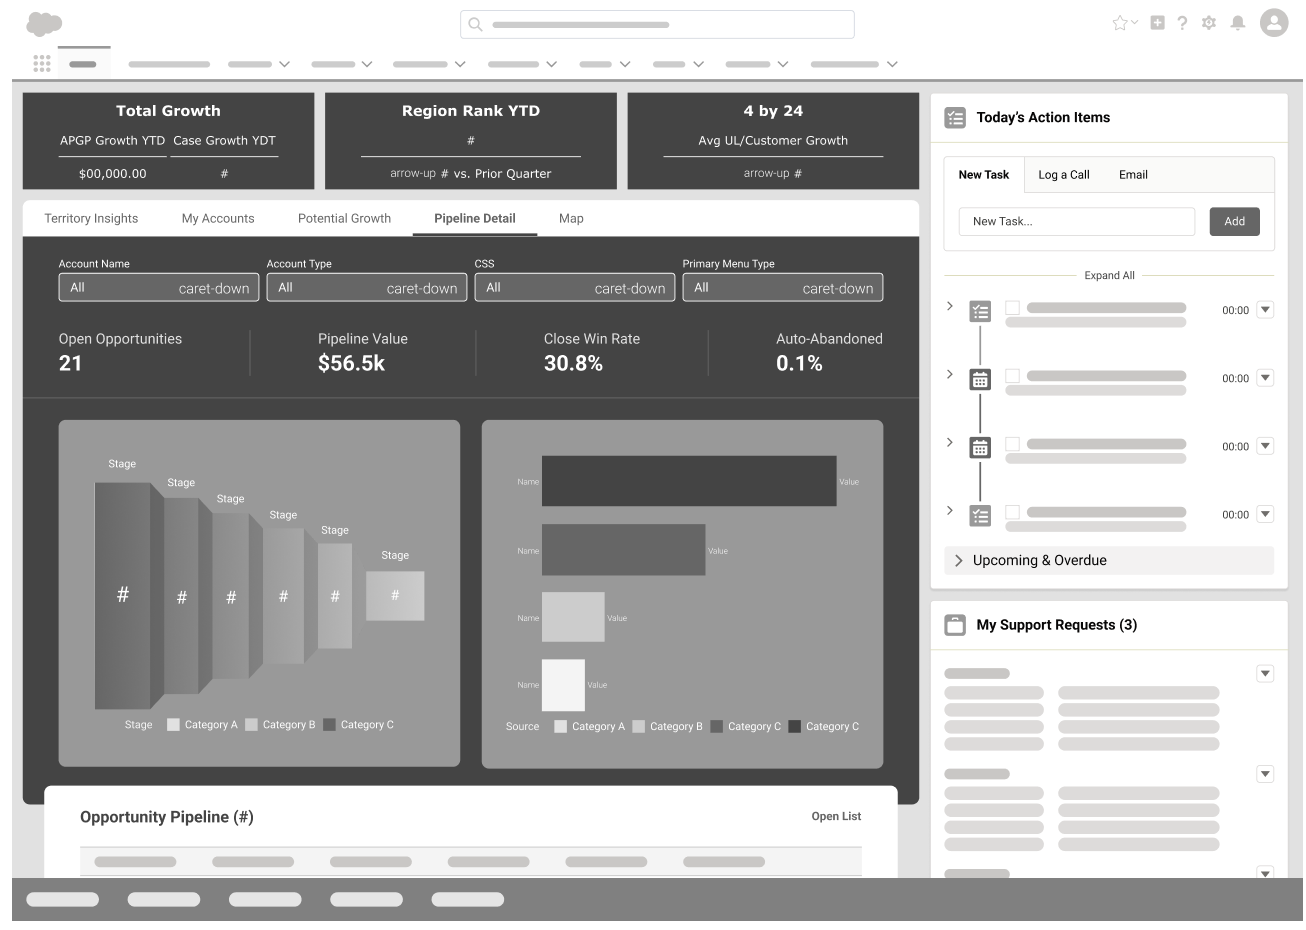
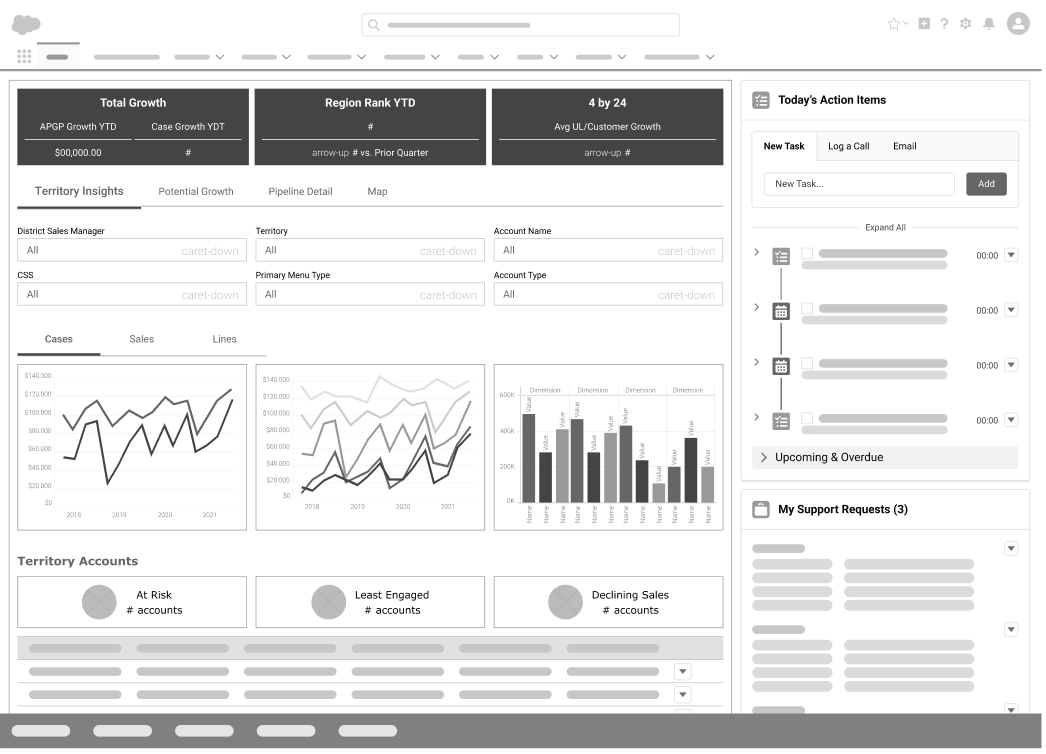
Created and tested a clickable prototype, refining it through stakeholder feedback with iterative changes
Initial Iteration Prototype
AI Integration
Identified a need for more actionable user guidance within the dashboard
Integrated Salesforce Einstein tool (AI) for interactive, data-driven recommendations
Einstein allowed users to ask questions and receive next-step suggestions in real time
Added action buttons for quick navigation to relevant pages or contacts
Created a clickable prototype showcasing AI-driven interactions and outcomes
AI Chatbot Prototype
Outcome & Impact
Designed a Salesforce Einstein–powered dashboard to deliver actionable sales insights
Explored Next Best Action AI tool and Chatbot AI tools to allow for quick, data-informed decisions
Quickly pivoted when licensing and data limits emerged, optimizing the design with available tools
Delivered a streamlined, user-friendly dashboard highlighting key metrics and next-step actions
Resulted in a clear, efficient interface that empowered sales teams to act decisively and improve prioritization
Decided to add a “Whitespace” tab, to be aware of the gaps in the market
Decided that the final prototype would allow the user to benefit from a “My Network Trends” for the sales rep to know the current trends
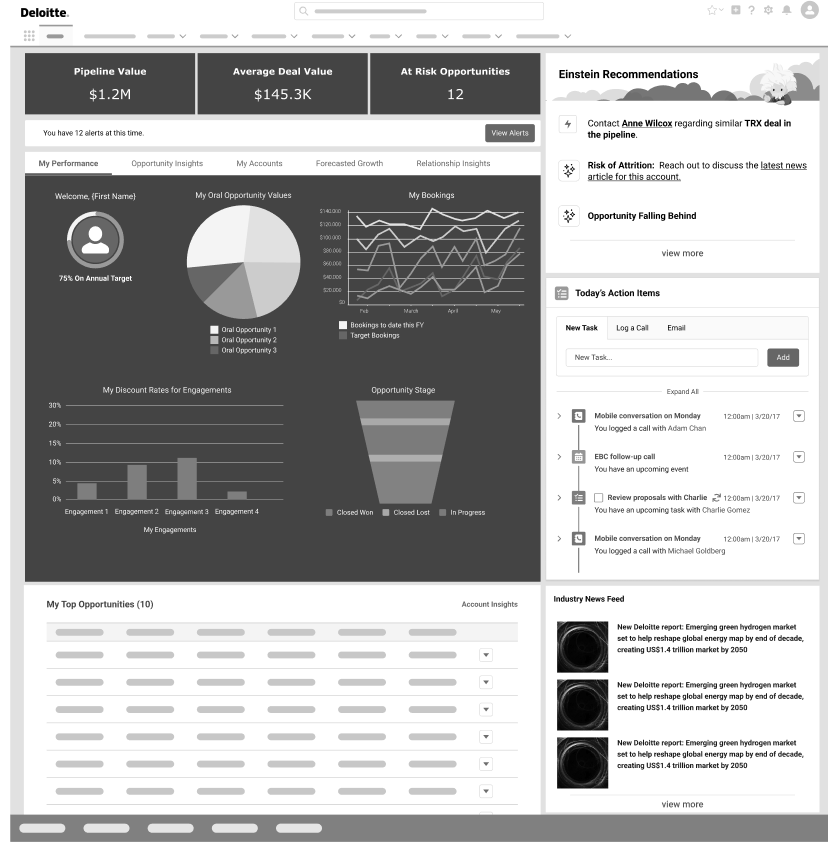
Final Prototype
Final Deliverable
Pivoted from a complex AI solution to a scalable, streamlined dashboard due to data and licensing limits
Maintained transparent collaboration with the client throughout the redesign process
Delivered a universal solution that met diverse sales team needs and resolved prior UX pain points
Produced a clear, user-friendly interface that improved usability and laid the groundwork for future AI integration, when licensing becomes approved
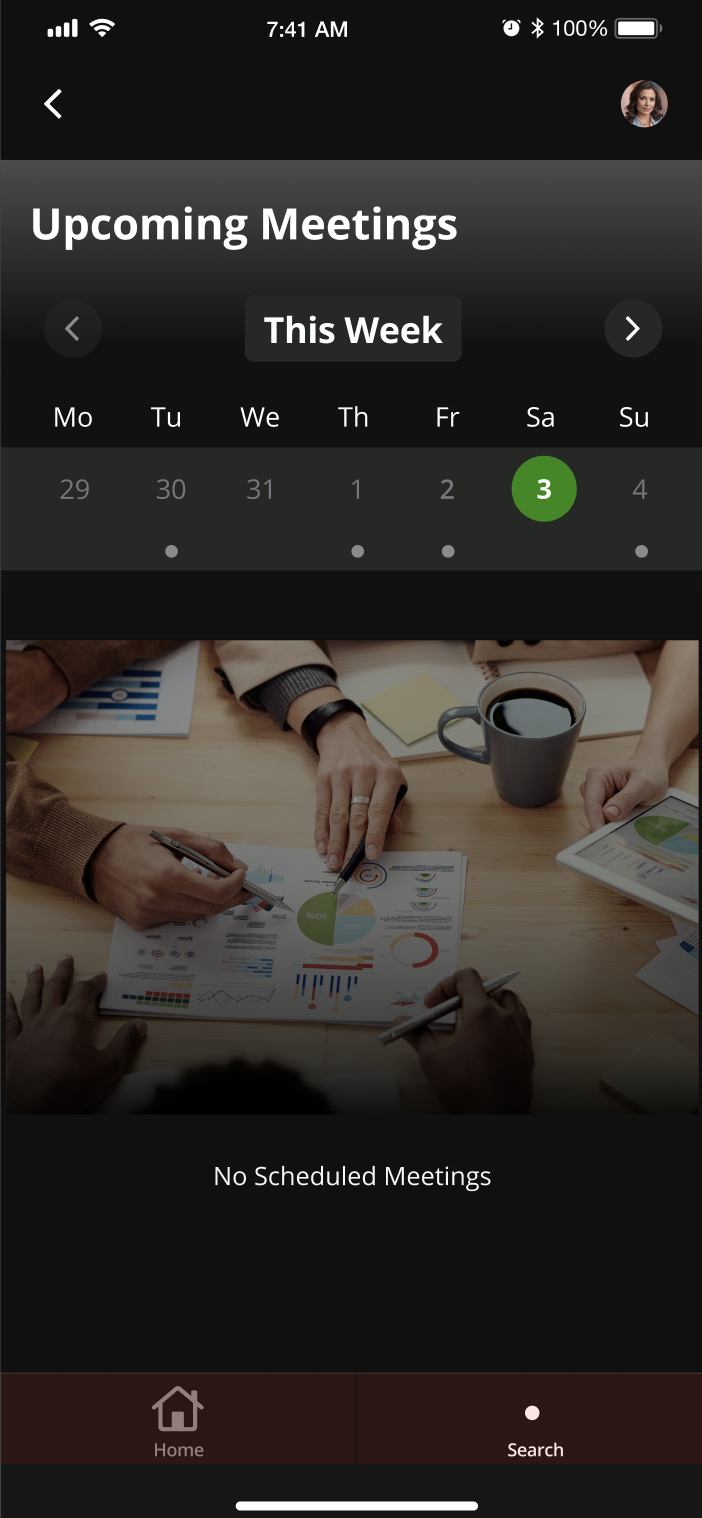
Mobile Exploration
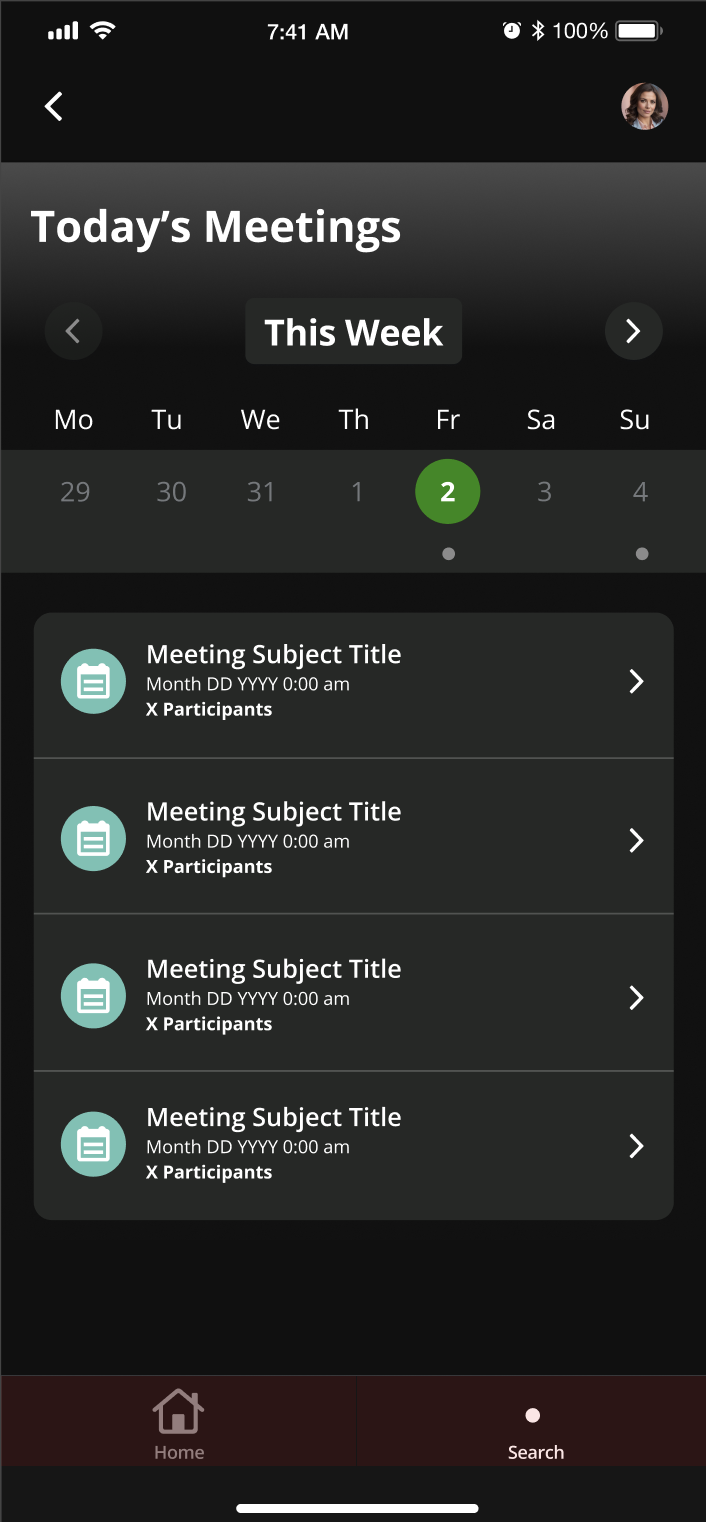
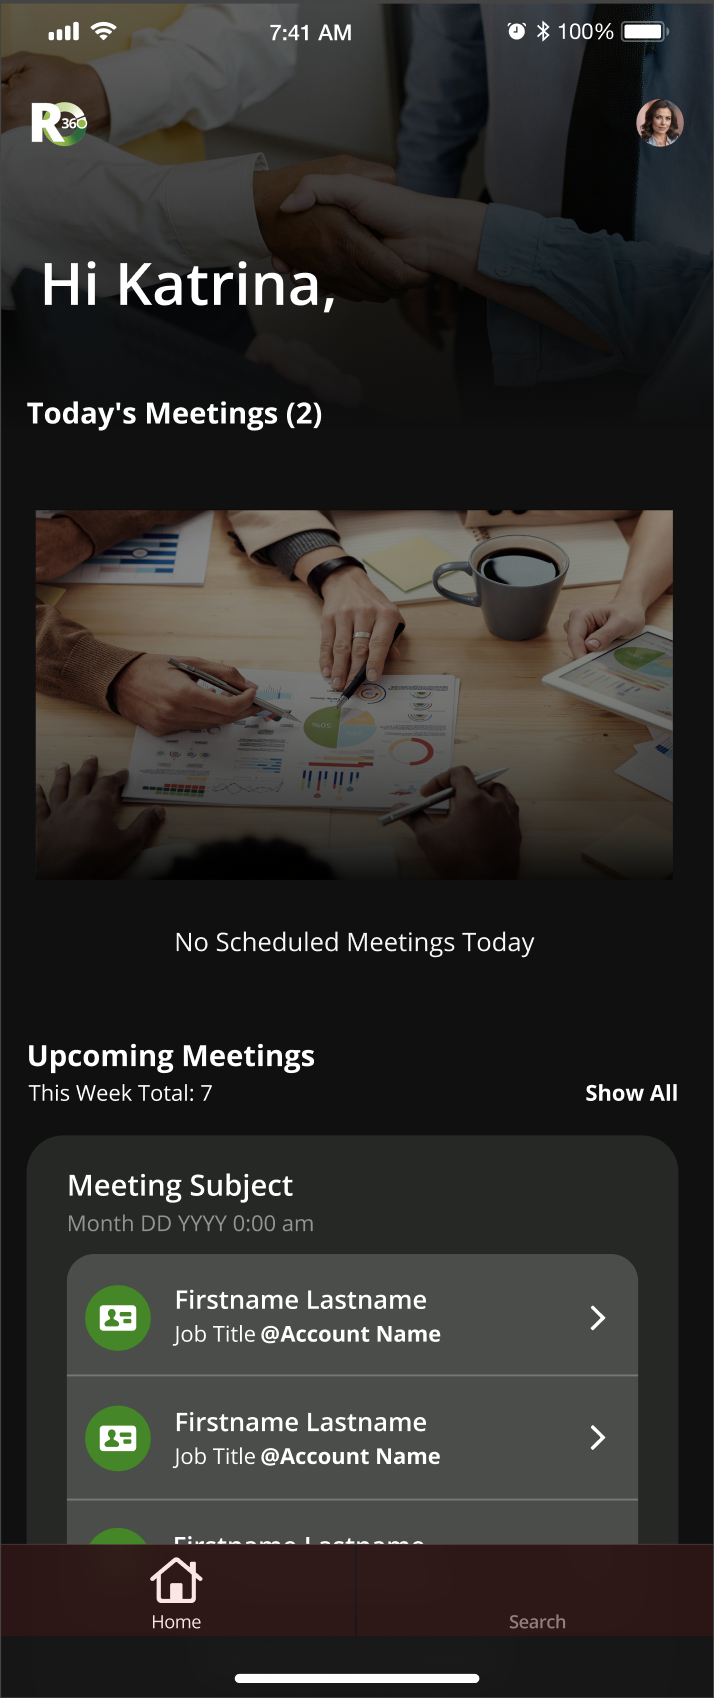
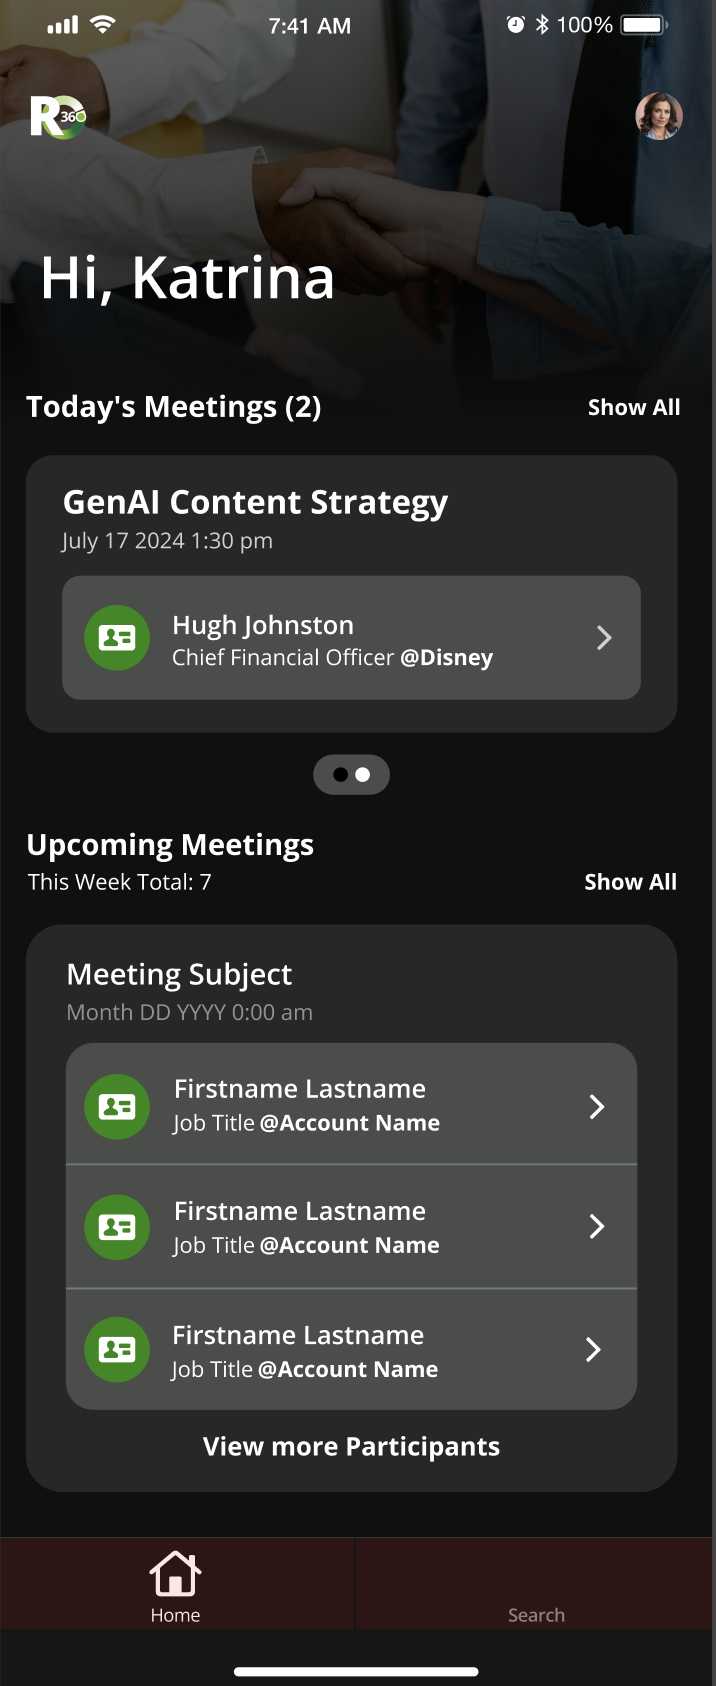
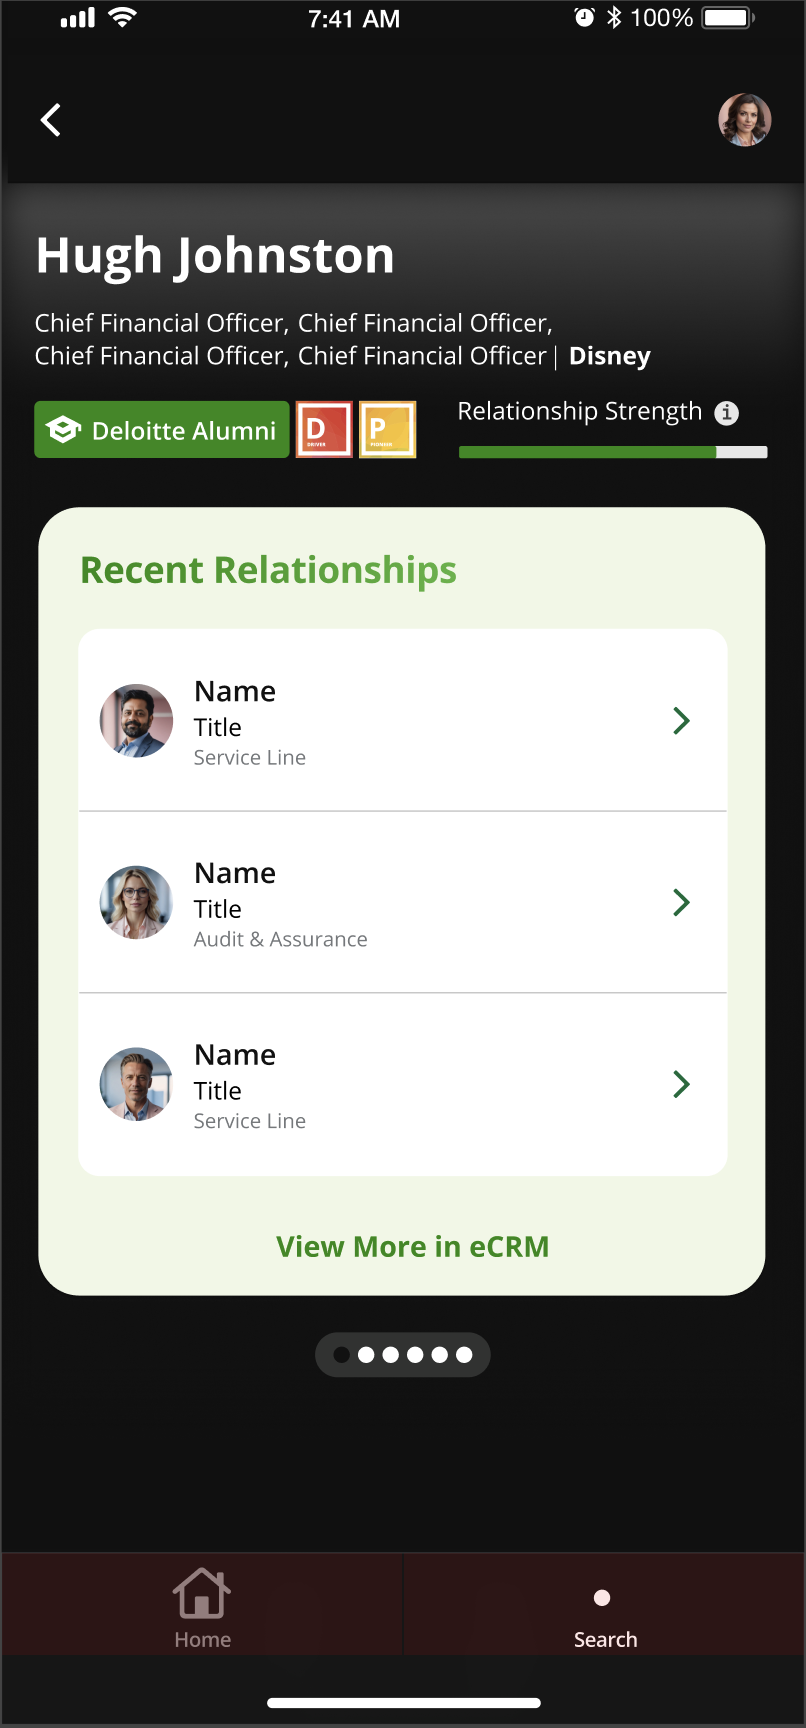
Assisted the mobile team dedicated to the Deloitte mobile experience
Suggested styling recommendations and helped build custom components
Helped with viewing upcoming meetings workflows, and how they might display